Testing your website’s speed is crucial to understanding how it performs for users and where improvements can be made. In this article, we’ll walk you through how to properly test your site using two popular tools: GTmetrix and Google PageSpeed Insights. We’ll also explain what to look for in your results.
How to properly start a speed test?
Before running any speed test, it’s essential to use the correct version of your website’s URL. Make sure you’re testing the exact URL that your visitors see when accessing your site, including:
- HTTP or HTTPS
- www or non-www
For example, if your site loads as https://www.example.com, using http://example.com in a speed test will show inaccurate or lower performance scores.
GTMetrix
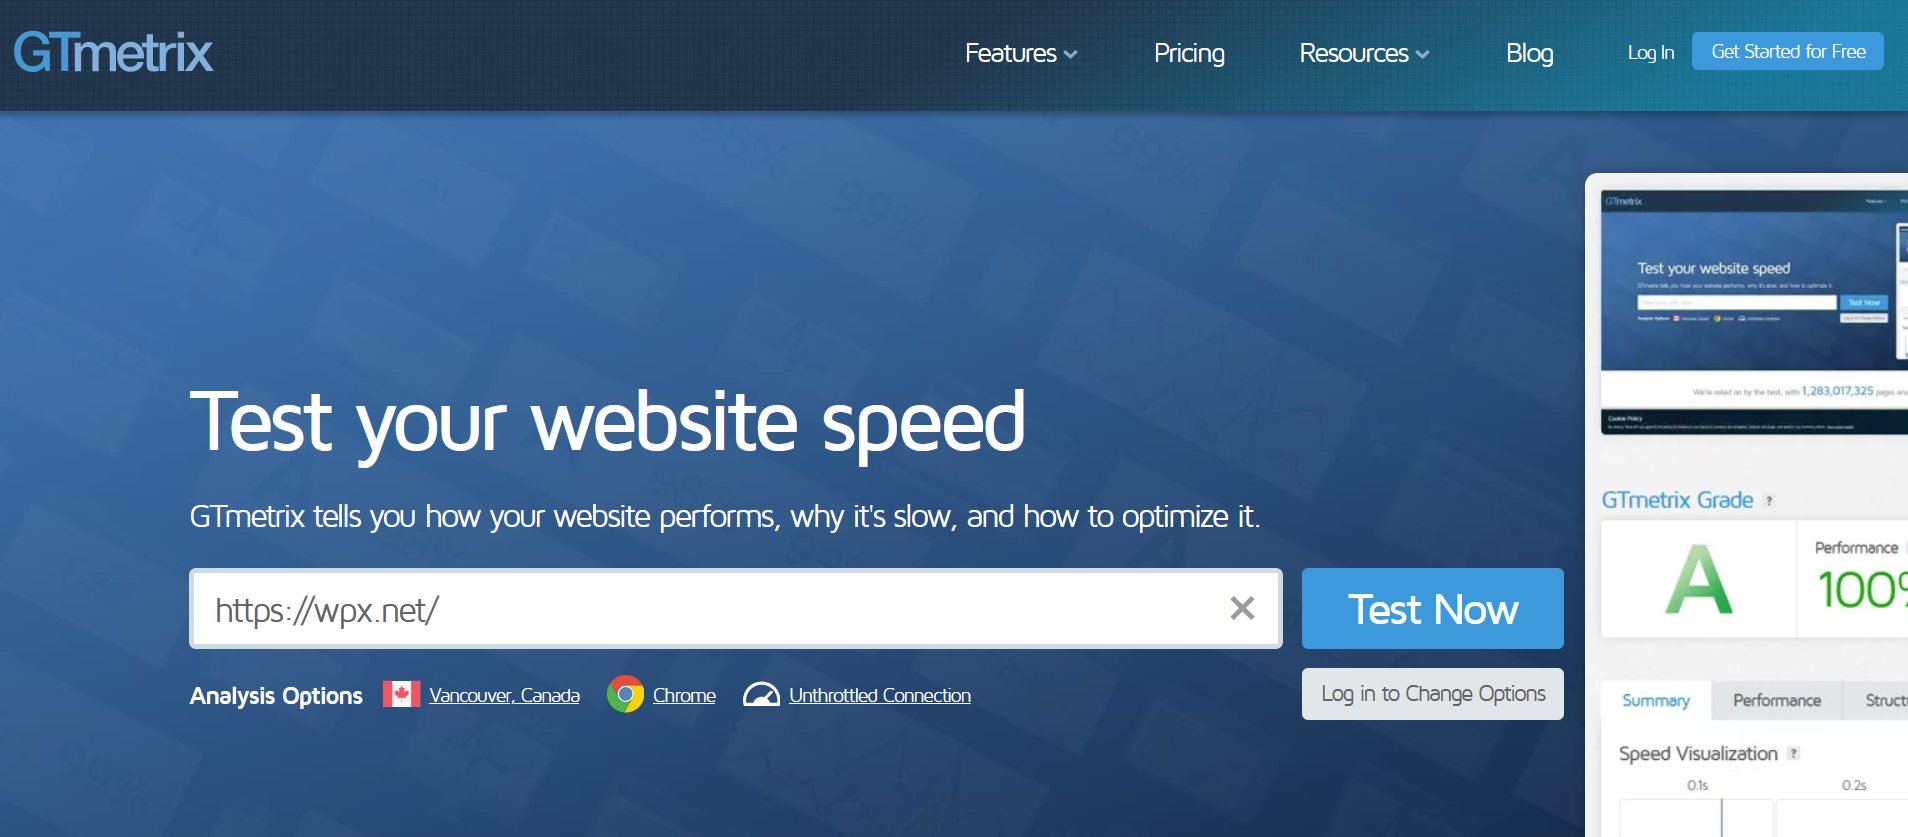
GTMetrix is one of the most popular and detailed performance analysis tools used in the WordPress community.
How to use GTmetrix:
- Visit GTmetrix.com
- Enter your full website URL.
- Click the Test Now button.
After the scan is complete, GTmetrix will generate a detailed report including:
- Summary: Offers an overview of performance scores, Time to First Byte (TTFB), and Fully Loaded Time, with visual breakdowns of the loading sequence.
- Performance: Displays scores from Google’s Lighthouse engine. While highly technical, focusing on TTFB, First Contentful Paint (FCP), and Speed Index is a good starting point.
- Waterfall: Provides a visual breakdown of every request loaded by your site. This is especially useful for identifying slow-loading resources such as large images, third-party scripts, or unused files.
Want to learn how to read a Waterfall chart? Click here for our detailed guide.
Google PageSpeed Insights
Google PageSpeed Insights (PSI) is another essential tool that measures your site’s performance on both mobile and desktop devices.
How to use PSI:
- Visit PageSpeed Insights
- Enter your website URL.
- Click Analyze.

What it provides:
- Separate performance scores for mobile and desktop views.
- Core Web Vitals metrics like Largest Contentful Paint (LCP), Cumulative Layout Shift (CLS), and Total Blocking Time (TBT).
- Suggestions for improvements (often very technical and developer-focused).
Stuck at any point? Don’t worry, just click the live chat widget in the bottom-right, and one of our support agents will assist you in under 30 seconds.